I have invested in stocks for well over a decade. I tried everything from daytrading to long-term trading; Using dozens of different indicators to determine when to make a move, and when not to. There are lessons I’d like to share.
You can skip to the bottom (look for TL;DR) for the quick guide or continue reading for the depth. When I first started investing, I was making all decisions off of the indicators on charts, usually the 3-month interval charts. Many indicators I’ve tried over the years included the RSI (Relative Strength Index), MA (Moving Average), Bollinger bands, and a variety of oscillators like the stochastic are just some examples. They’re great for confirming timing on trades, but never great for determining when to trade. I found myself relying too heavily on these indicators and then the stock completely tanked or provided little gains.
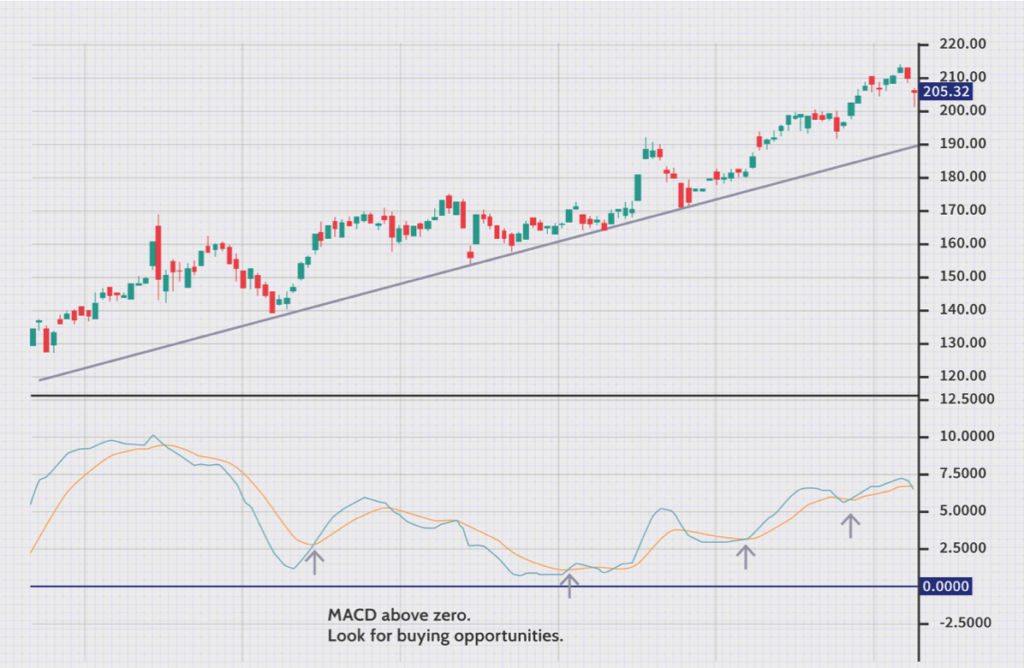
I even went on a technical analysis reading candlesticks on the charts where the location of the body helps determine the movement of the stock. Investopedia has a good quick guide on the most common indicators used here, including the bearish/bullish engulfing pattern, evening star, and bearish/bullish harami.

There has been one indicator I’ve relied on, and it’s the Ichimoku Cloud designed by Goichi Hosoda.
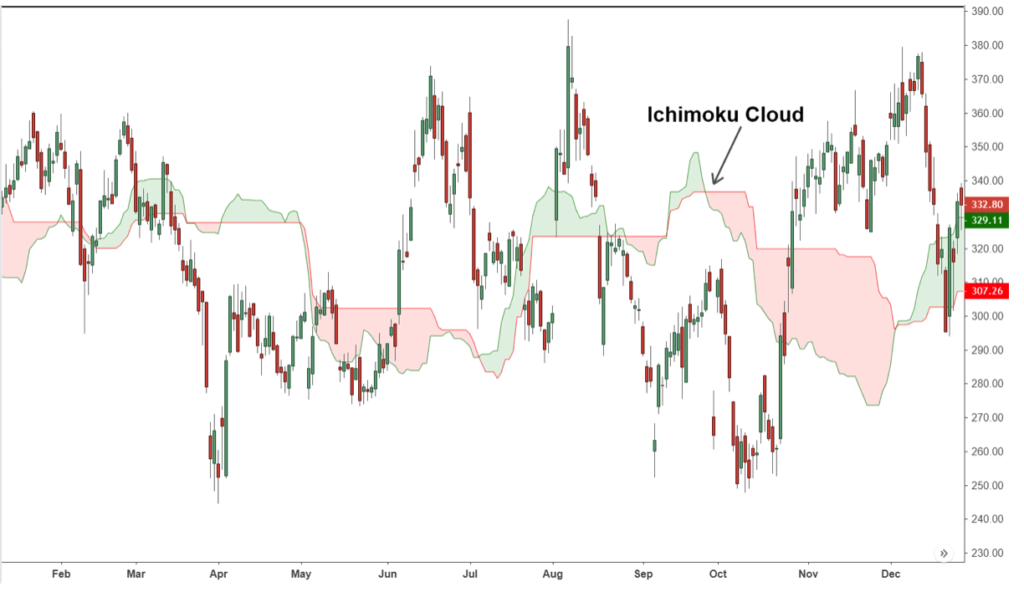
The Ichimoku Cloud was perfected over several years by Hosoda-san and includes viewing the momentum over 26 weeks and comparing them against 52 weeks of momentum as a lagging indicator. Using the example above, if you sold stocks where the arrow is pointing just before October, you would have profited. It’s not ideal for big gains, but it is the most accurate indicator I’ve ever used. The “cloud” that is colored in red shows that it was expecting to drop over time as the green line moves below the red line. This can provide you a good resistance point or a potential buy point.
It’s all meaningless, though. What I mean by this is that the indicators don’t mean anything if you don’t understand the company that owns the stock. Earlier in the 2010s – probably 2013 – I invested in Tesla, an electric vehicle company. I read news that they were completely sold out of preorders, so I made a move on the stock. The stock rose to $350 in several months and I sold it. Of all the years I’ve invested, this was my biggest mistake. Ever. Just last month, the price climbed over $3,000 before the stock split. My initial investment was $500. When I sold it, my investment turned to $3,000. If I had kept it through last month, it would be an estimated $80,000 (per a stock return estimator). I recently invested in another company, AMD, which is building the microchips for both Microsoft XBox and Sony Playstation. Reading the news and finding companies that have huge growth opportunities is a very strong technique that indicators cannot beat. It has gained 58% since I purchased it.
I started trading on a variety of stocks using the same technique as I did with Tesla: What company has a strong vision of change. Some stocks I invested in were with green energy, where I believe oil companies will eventually collapse unless they convert to renewable energy like fans, solar, etc. I still made the same mistakes I did with Tesla and sold some of them when I saw the price lowering, but it was always temporarily. In some cases, I sold at a good time as the stock collapsed completely and still hasn’t recovered. There was another variable I wasn’t looking at that I should’ve: finances.
Every quarter, a majority of publicly traded companies release a variety of reports for shareholders. The three high-level reports that are the most accessible include the Income Statement, Cash Balance, and Cash Flow. I’m not going to pretend I’m an expert on these, but there are plenty of books available to help guide you. I look at several things such as revenue, investing costs, EPS (Earning Per Share), operating expenses, EBITDA (Earnings Before Interest, Taxes, Depreciation, and Amortization), and changes in cash (money available in case something happens).
When I review the finances of a company, I am looking for a company that is improving year-over-year (YOY). How are they performing the past four quarters? Is net income growing or dropping? Are sales increasing? Are they investing more or less? Are the expenses dropping? These are questions I want answered.
A company can have incredible finances, but it doesn’t mean it won’t cannibalize itself from within. If there is a lack of direction, or staff are not supportive of the company vision, it’s unlikely the company will survive for long and stay profitable. This is also true with ethical companies and companies that are involved within their communities, which often correlates to staff happiness. Happy staff reduces turnover and keeps strong talent to help evolve the company.
Case Study: Costco
I love Costco as both a customer and investor. Loving a company is a good reason to invest in them, because if you love them then someone else likely does too. I will talk about everything I did above in reverse. Costco is well-known for paying employees more than other similar positions. Looking at Glassdoor, you can see they have a 4.0/5.0 review for a place to work.
The vision is already sold to me since I’m a customer; I love the philosophy of selling one good product at a very low price with a subscription model. For example, any grocery store will sell 5-10 choices of Peanut Butter. The psychology of choice may overload my mind and I walk out of the story without buying any. At Costco, though, I think about Peanut Butter and find one.
Costco has relatively good financials. The graph below is a high-level overview:
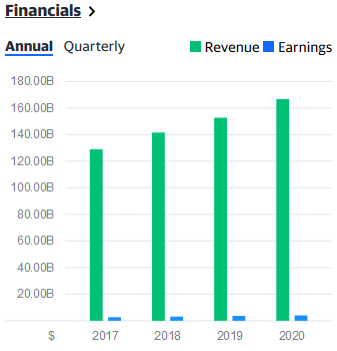
Revenue consistently grows, but earnings had a bit of a drop in 2020. Then we apply our chosen indicators, or the Ichimoku Cloud as my preference, over a 6-month period.
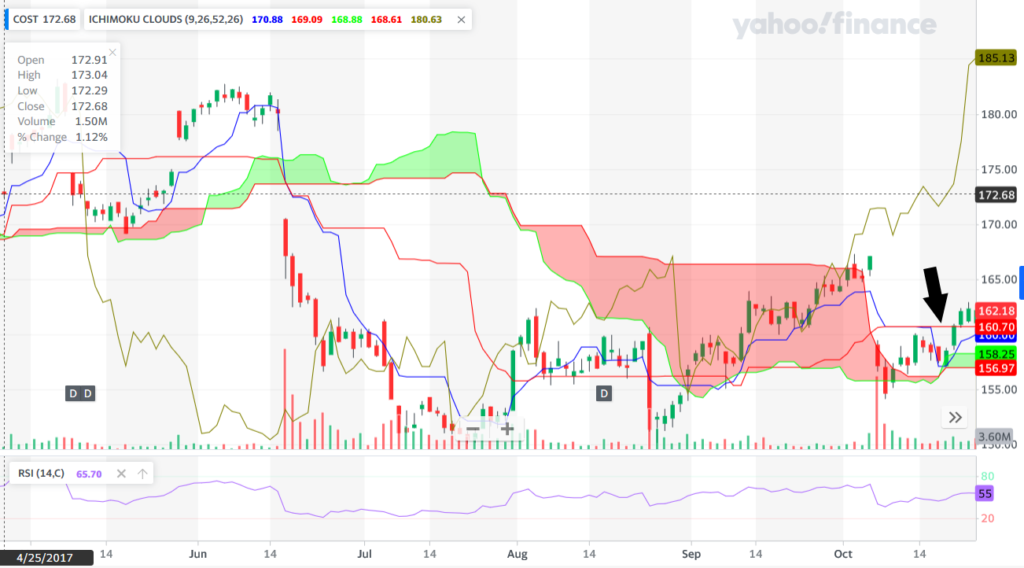
At this point on October 19th, 2017, you can see that the moving averages are showing a positive trend (green line crosses above red line). You can also see the gold color line above, which shows predicted support. I could potentially sell at $172-ish, as it shows. I would’ve made money one month later.
If I put in $1,000 on October 19th and sold on 11/22/2017 when it reached $172, I would’ve made $1,100 (or $100 Return on Investment).
Alternatively, I could’ve waited until I saw the red line cross the green line again. This happened on 4/16/2018 at ~$193 per share. My return would’ve been $257.55.

If I never sold it and held on to it the entire time, it would be worth $2,245.75 as of writing. This figure includes dividends and returns on those dividends. A dividend is a distribution of the company’s earnings to shareholders. Think of it as a bonus package saying, “Thank you for investing in us!” Costco currently has a return of $2.80 per share, which occurs every quarter. Ideally, you want to invest in companies where the dividend increases at least once over a 5-year period.
The Chowder rule on dividends is that the sum of the dividend yield and the trailing 5-year dividend growth rate must be at least 12. Or, if the dividend yield is less than 3 percent – the sum of the dividend yield and the trailing 5-year dividend growth rate must be at least 15. I don’t necessarily follow this rule, but it does have some strength to it.
Again, my biggest mistake was selling Tesla stock, but it was a good thing. If I hadn’t sold it, I wouldn’t have learned any of these lessons and purchased other great stocks that have done a decent job for my portfolio. After many mistakes and some successes, that $300 has turned to $9,000. Since the S&P 500 grows every year and has consistently, you’re logically better off investing in a stock like SPY and holding on to it than daytrading and fighting through wins and losses. Below is a snapshot of my portfolio over the past 3 years.
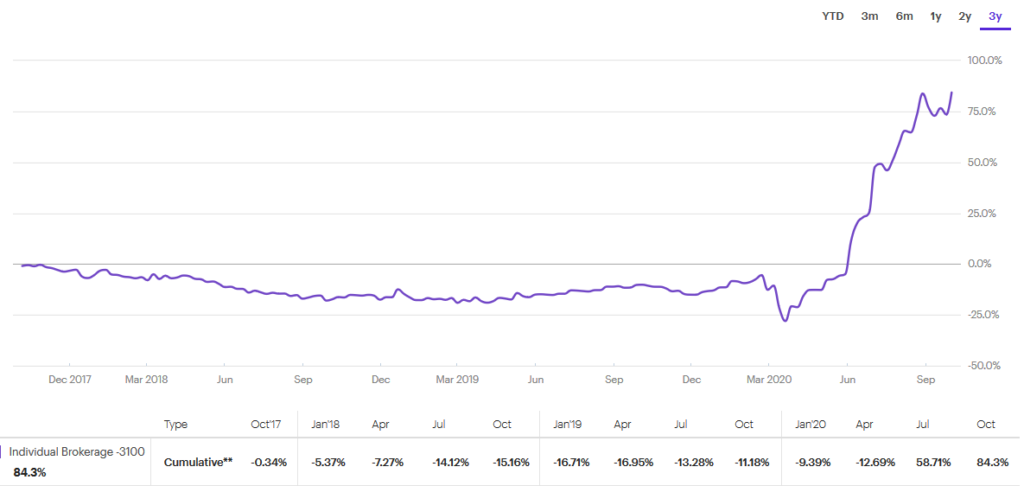
I flirted losing with 25% of my portfolio in 2018 and 2019 due to fighting wins and losses and attempting day/week trading using news and indicators alone. It clearly wasn’t enough, and I needed to re-evaluate what made my past stocks successful. Also, ignore the drastic increase in mid-2020 – this was due to the stock market crash from COVID-19 and rapid expansion of economic recovery.
Let’s reevaluate the same graph with the S&P 500 Index – or if I just invested in the stock ticker SPY or VXX:
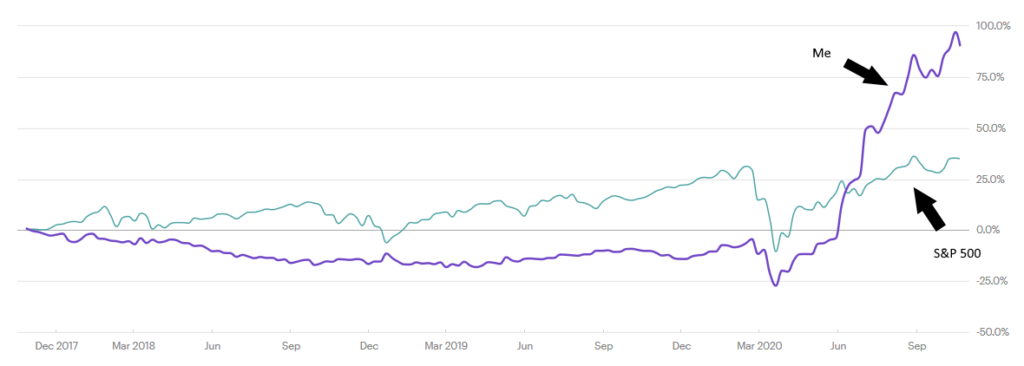
Clearly, I would’ve been better off for 3 years sticking with market index funds. However, that moment shifts in May/June 2020, when I started adopting my new strategy and it surpasses the index. I have to be optimistically cautious on this and wait a few years to see if my strategy is better or worse than the index.
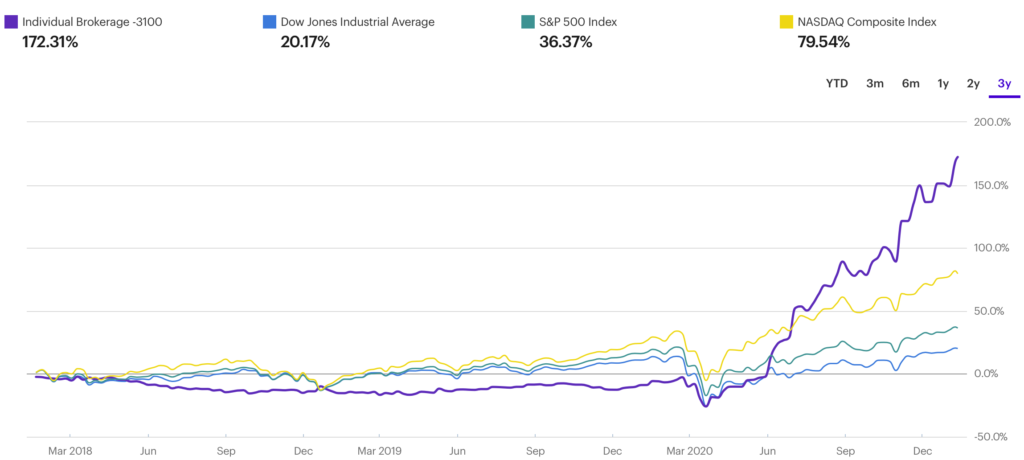
It’s also important to know when to sell. If leadership shakes up and it looks negative, it’s a good time to move out of the stock once the indicators show. Like purchasing, don’t rely on the indicators nor falling stock prices alone. Instead, focus on the direction of the company and use indicators as a confirmation on buy/sell prices. Below is my continually updated results:
TL;DR
My investment strategy is:
- Read the news and understand when a company has a future growth potential
- Invest in a company that is ethical, community-driven, and has a positive culture
- Invest in a company with usually consistent financial growth – expect blips in the market
- Invest in a company with dividends that grow at least once every five years and reinvest the dividend back in the stock
- Use technical indicators to help determine when to buy a stock
- Hold on to a stock unless the company looks like it’s headed to a downward spiral
Comments are closed.